How fast do you want it?

In March I wrote about JSSE, a JavaScript engine an agent built from scratch in Rust. It passed 100% of test262 non-staging tests. It was also slow. Intentionally so. The "What's Next" section of that post named bytecode compilation as the obvious next step, with 10x to 100x to be gained.
This post is not about bytecode.
Seven weeks later, the same test262 suite runs 4.73x faster on the same machine, against the same source checkout, with the same toolchain. JetStream geometric mean speedup is 1.92x across 19 comparable workloads. Seven JetStream workloads that previously timed out or errored now run clean. The full numbers and the methodology are in docs/perf/2026-05-07/benchmark-report.md.
What changed is not the architecture. JSSE is still a tree-walking interpreter. No bytecode VM, no inline caches, no hidden classes. The agent and I attacked the constant factors of the existing engine, one issue at a time.
The Dial
The previous post promised bytecode. I didn't do bytecode this round, and that was a deliberate scoping choice, not an agent limitation. Bytecode is a feature: a new component, a new IR, a new code path through the engine. Optimization is making the existing code faster: tighter object access, fewer allocations, better hot paths in the obvious places. I asked the agent for the second, not the first. The result is the second. Bytecode is for another post.
The Loop
The workflow was boring. Audit the slowest test262 scenarios and the JetStream workloads that timed out or errored. Group them into categories. Open a GitHub issue per category. Plan, implement, open a PR. Two agents review the PR; the implementing agent runs my pm-autofix-pr skill in a fixed-point loop, addressing review comments and CI failures until nothing more comes back. Merge. Pick the next issue. Repeat.
I still didn't read the code. The difference from the March post is that two agents now argue about each PR before merge, instead of me clicking through. Worktrees ran in parallel for the bigger refactors, same pattern as the Temporal API push from the first phase.
The Cost
| First phase (Jan 27 to Mar 17) | This phase (Mar 17 to May 7) | |
|---|---|---|
| API-equivalent cost | $4,619 | $1,879 |
| Active days | 47 | 19 in a 42-day window |
| Tokens | 8.9B | 3.1B |
| Hands-on time | ~4 hours total | very little, mostly background |
Half the cost, less than half the active days, less than half the tokens. Most of those days were minutes here and there in a tab I wasn't really watching. The dial moved by 2x to 5x.
Where the Wins Came From
The dominant work was a series of 29-plus PRs under issue #66: migrating object access from Rc<RefCell<Object>>-style indirection to a cell-and-handle scheme. Less pointer chasing, less reference counting traffic, fewer short-lived allocations. The kind of patient mechanical refactor that pays off only in aggregate. Exactly the work humans tend to avoid.
The 10x to 20x outliers in the test262 long tail came from regex. The slowest scenarios in March were almost all RegExp Unicode property escape tests, each taking 60 to 80 seconds enumerating thousands of codepoints. The same scenarios now run in 3 to 5 seconds, mostly from tightening the matcher and avoiding redundant work in character class construction.
The JetStream recoveries (Air, ML, proxy-mobx, proxy-vue, raytrace-public-class-fields, regexp-octane, sync-fs) were a mix. Some were the same constant-factor wins above. Several were real bugs surfaced by JetStream that test262 didn't reach. Optimization work doubles as fuzzing in that sense. JetStream gave the agent a different shape of failure to chase, and chasing those failures shook out things test262 had quietly been passing despite.
Receipts
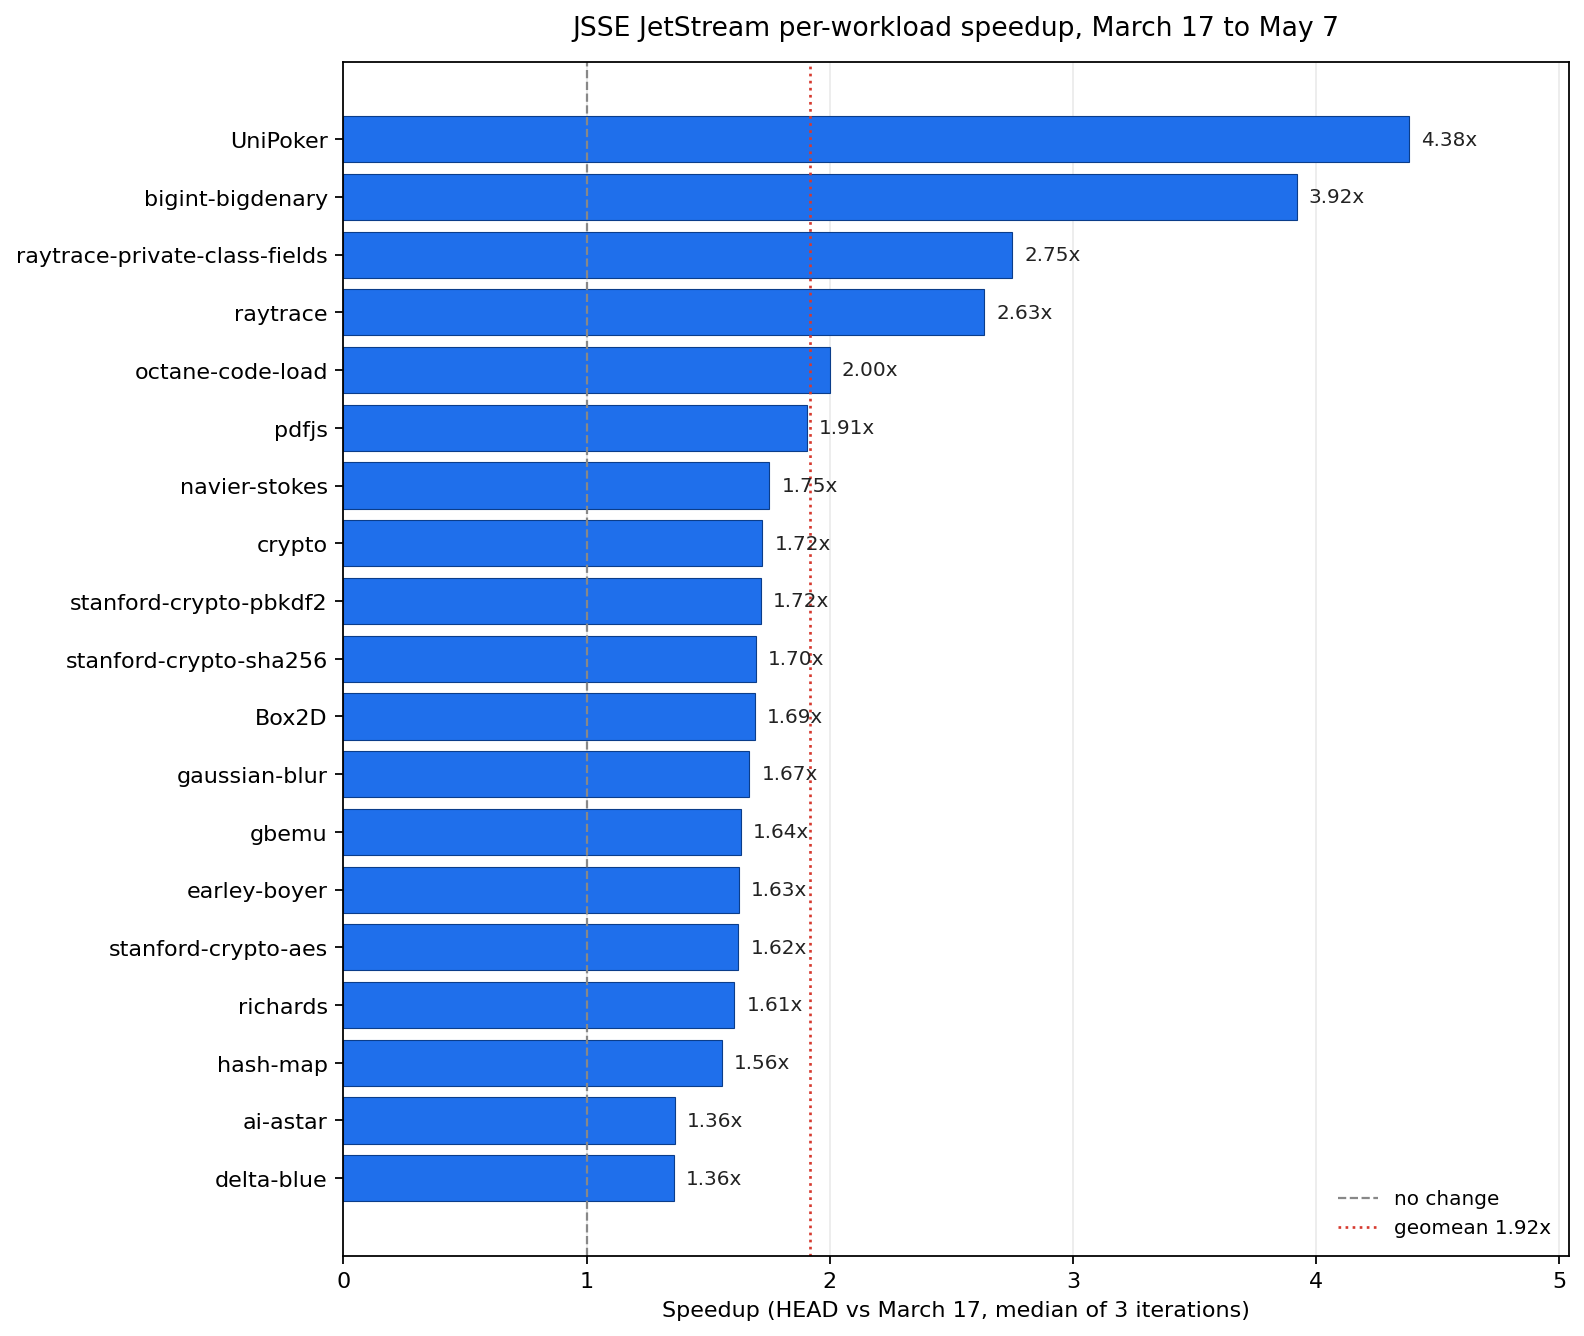
JetStream comparable workloads. Median per-workload over three iterations on each binary (re-run on 2026-05-07). Geometric mean speedup across all 19 is 1.92x, median per-workload speedup is 1.70x.
| Benchmark | March 17 (ms, median) | HEAD (ms, median) | Median speedup |
|---|---|---|---|
| UniPoker | 20,974 | 4,786 | 4.38x |
| bigint-bigdenary | 17,875 | 4,560 | 3.92x |
| raytrace-private-class-fields | 45,252 | 16,456 | 2.75x |
| raytrace | 36,692 | 13,927 | 2.64x |
| octane-code-load | 138 | 69 | 2.00x |
| pdfjs | 23,213 | 12,183 | 1.91x |
| navier-stokes | 9,016 | 5,147 | 1.75x |
| crypto | 11,713 | 6,797 | 1.72x |
| stanford-crypto-pbkdf2 | 8,448 | 4,921 | 1.72x |
| stanford-crypto-sha256 | 9,070 | 5,349 | 1.70x |
| Box2D | 16,788 | 9,924 | 1.69x |
| gaussian-blur | 53,627 | 32,138 | 1.67x |
| gbemu | 58,400 | 35,719 | 1.64x |
| earley-boyer | 31,760 | 19,528 | 1.63x |
| stanford-crypto-aes | 13,910 | 8,567 | 1.62x |
| richards | 30,359 | 18,885 | 1.61x |
| hash-map | 115,326 | 74,139 | 1.56x |
| ai-astar | 56,767 | 41,620 | 1.36x |
| delta-blue | 21,885 | 16,096 | 1.36x |
JetStream went from 19 passing workloads out of 48 to 26 out of 48. Two timeouts became passes (ML, regexp-octane), one timeout became an error (js-tokens); five errors became passes; nineteen passed on both.
test262, full suite, average of two end-to-end runs each:
| Revision | Pass | Fail | Wall time |
|---|---|---|---|
March 17 (7a4d095) | 98,610 | 410 | 828.85s |
HEAD (14cb0fd) | 99,020 | 0 | 175.20s |
The 410 fails on the March 17 binary are not engine regressions. The March post quoted "100%" from JSSE's test runner, and @ivankra later caught in issue #58 that the runner was masking real failures by misclassifying some test outcomes as passes. So the 410 are a mix of those hidden failures and tests that landed in test262 between the March post and the May checkout. Thanks Ivan. HEAD passes all of them. Same suite, same checkout, same machine, same toolchain. 4.73x faster wall time at full pass.
The long tail collapsed harder than the median. The single slowest scenario in March was Function/prototype/toString/built-in-function-object.js at 71.05s. The same scenario on HEAD runs in 4.98s. The 30 slowest tests in March took 45 to 71 seconds each. Nothing on HEAD takes more than 21 seconds.
Top scenario speedups, passing on both revisions:
| Scenario | March (s) | HEAD (s) | Speedup |
|---|---|---|---|
RegExp/character-class-escape-non-whitespace.js:strict | 40.67 | 2.04 | 19.9x |
RegExp/property-escapes/.../Tulu_Tigalari.js | 64.33 | 3.74 | 17.2x |
RegExp/property-escapes/.../Avestan.js:strict | 62.07 | 3.78 | 16.4x |
RegExp/property-escapes/.../Anatolian_Hieroglyphs.js | 58.94 | 3.78 | 15.6x |
Function/prototype/toString/built-in-function-object.js:strict | 70.96 | 4.76 | 14.9x |
Function/prototype/toString/built-in-function-object.js | 71.05 | 4.98 | 14.3x |
JSSE is still much slower than Node. Node is a JIT, JSSE is a tree-walker, and that gap is structural. The point of this post is the delta, not the absolute.
What's Next
There is more to do. The open performance-label issues on the JSSE repo are the live receipt of that. Some of them will close in the same constant-factor way the cell-variant migration did. Others need actual architectural work. Bytecode compilation is a different magnitude of work and a different post.
When that post lands, the dial moves further. For now, this is where it is.
Comments